
Analytics & Observability
ClawbotPro offers two distinct but deeply integrated views to monitor your autonomous workforce: Analytics (for token costs, trends, and aggregate performance) and Observability (for deep-dive execution tracing, raw terminal logs, and failure diagnosis). Together, they ensure your agents are both cost-effective and perfectly deterministic.
Workspace Analytics
The Analytics dashboard (/dashboard/analytics) aggregates real-time data from your Supabase database and natively fetches raw EC2 Gateway token consumption (bypassing the database for immediate accuracy). It allows you to monitor exactly how much compute your agents are burning.
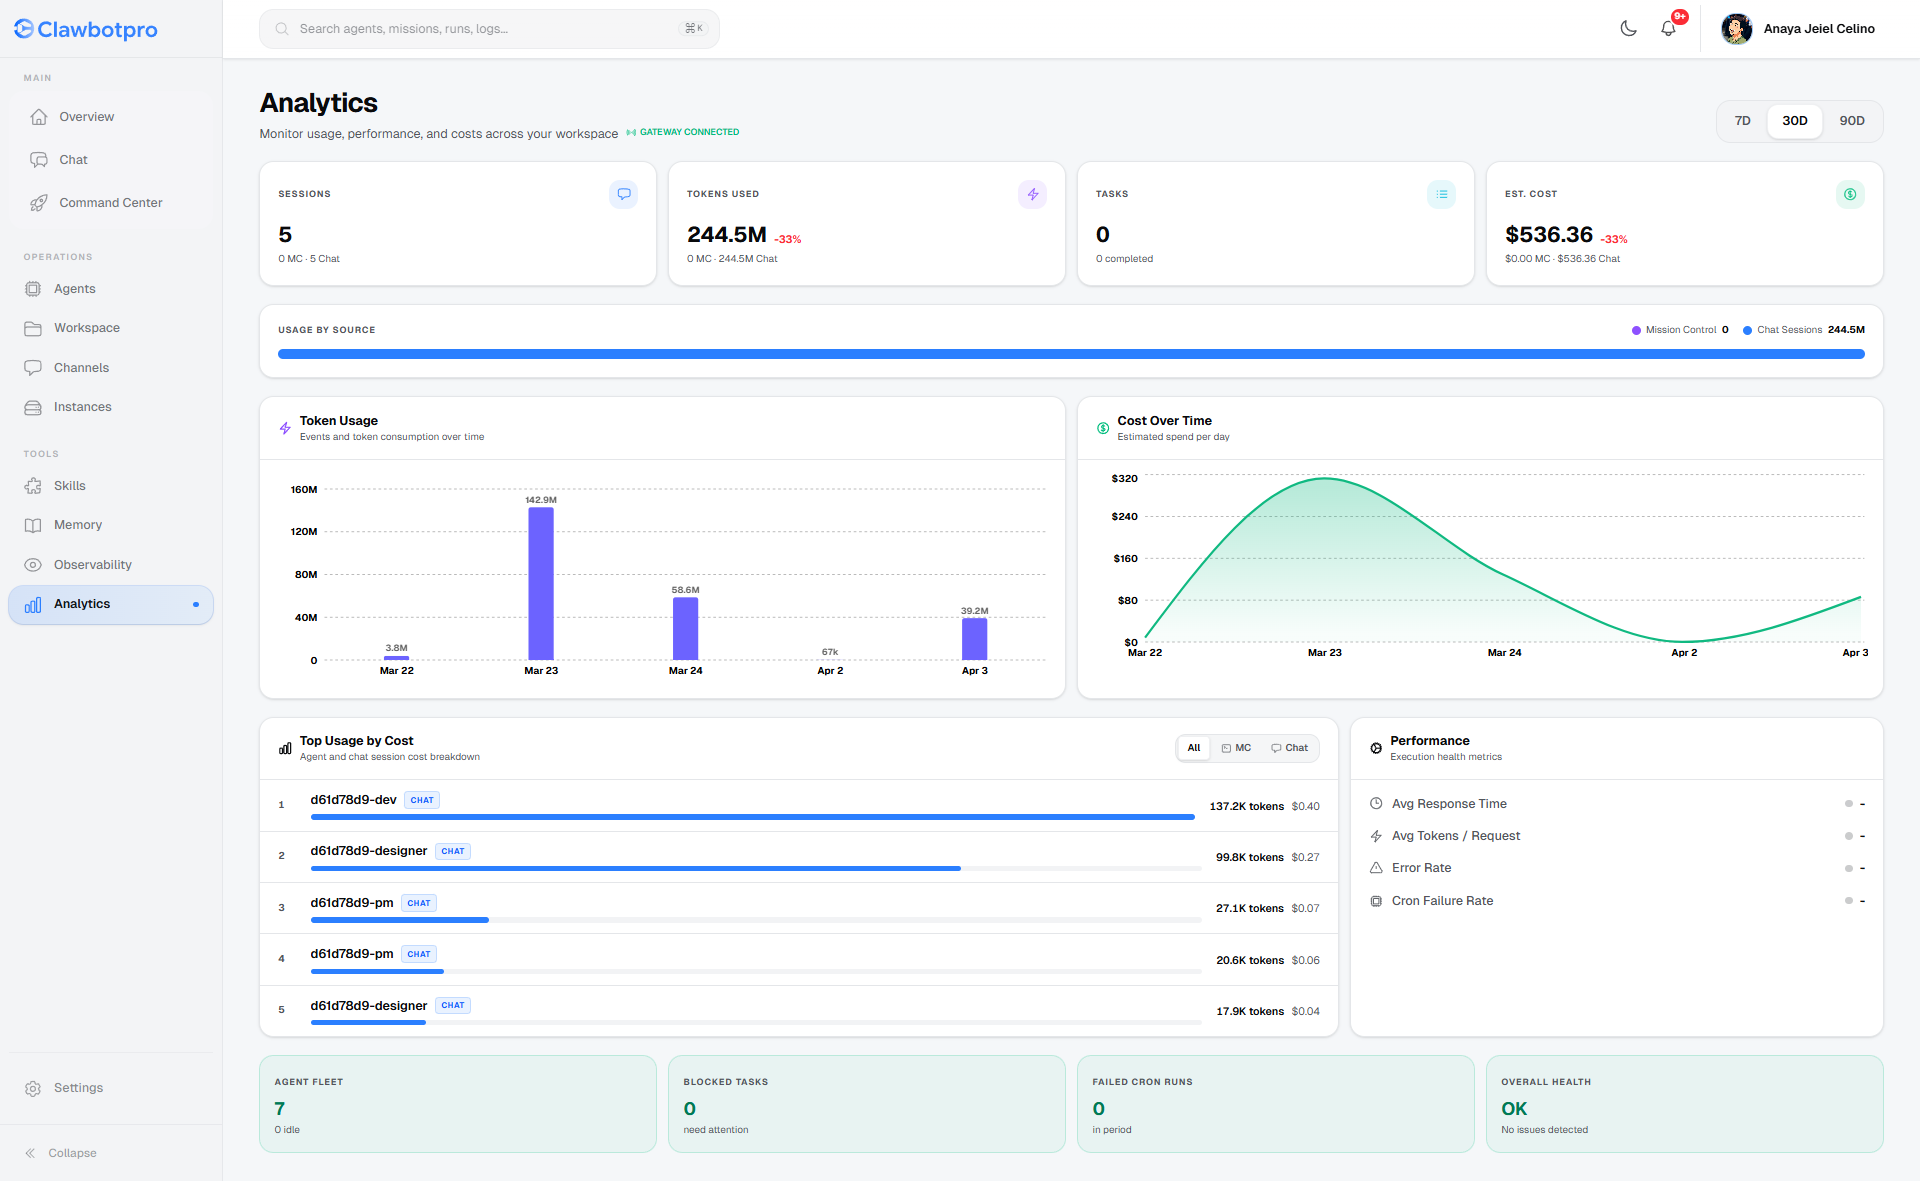
- Time-Series Graphs: View 7-day, 30-day, and 90-day trends for Token Usage and Estimated Spend. The data seamlessly splits usage between autonomous Mission Control background tasks and interactive Chat Sessions.
- Top Usage by Cost: This ranking table identifies the most expensive agents in your fleet. It calculates costs by mapping the specific model ID used during the execution (e.g., Gemini 3 Pro vs Llama 3) to its exact token rate.
- Health Diagnostics: Instantly view the error rate of missions and the failure rate of automated Cron runs, ensuring your production pipelines are stable.
Observability & Tracing
When an agent hallucinates, fails a test, or drops a connection, you need granular visibility to fix the prompt or adjust the MCP tools. The Observability suite (/dashboard/observability) is your X-ray into the agent's brain.
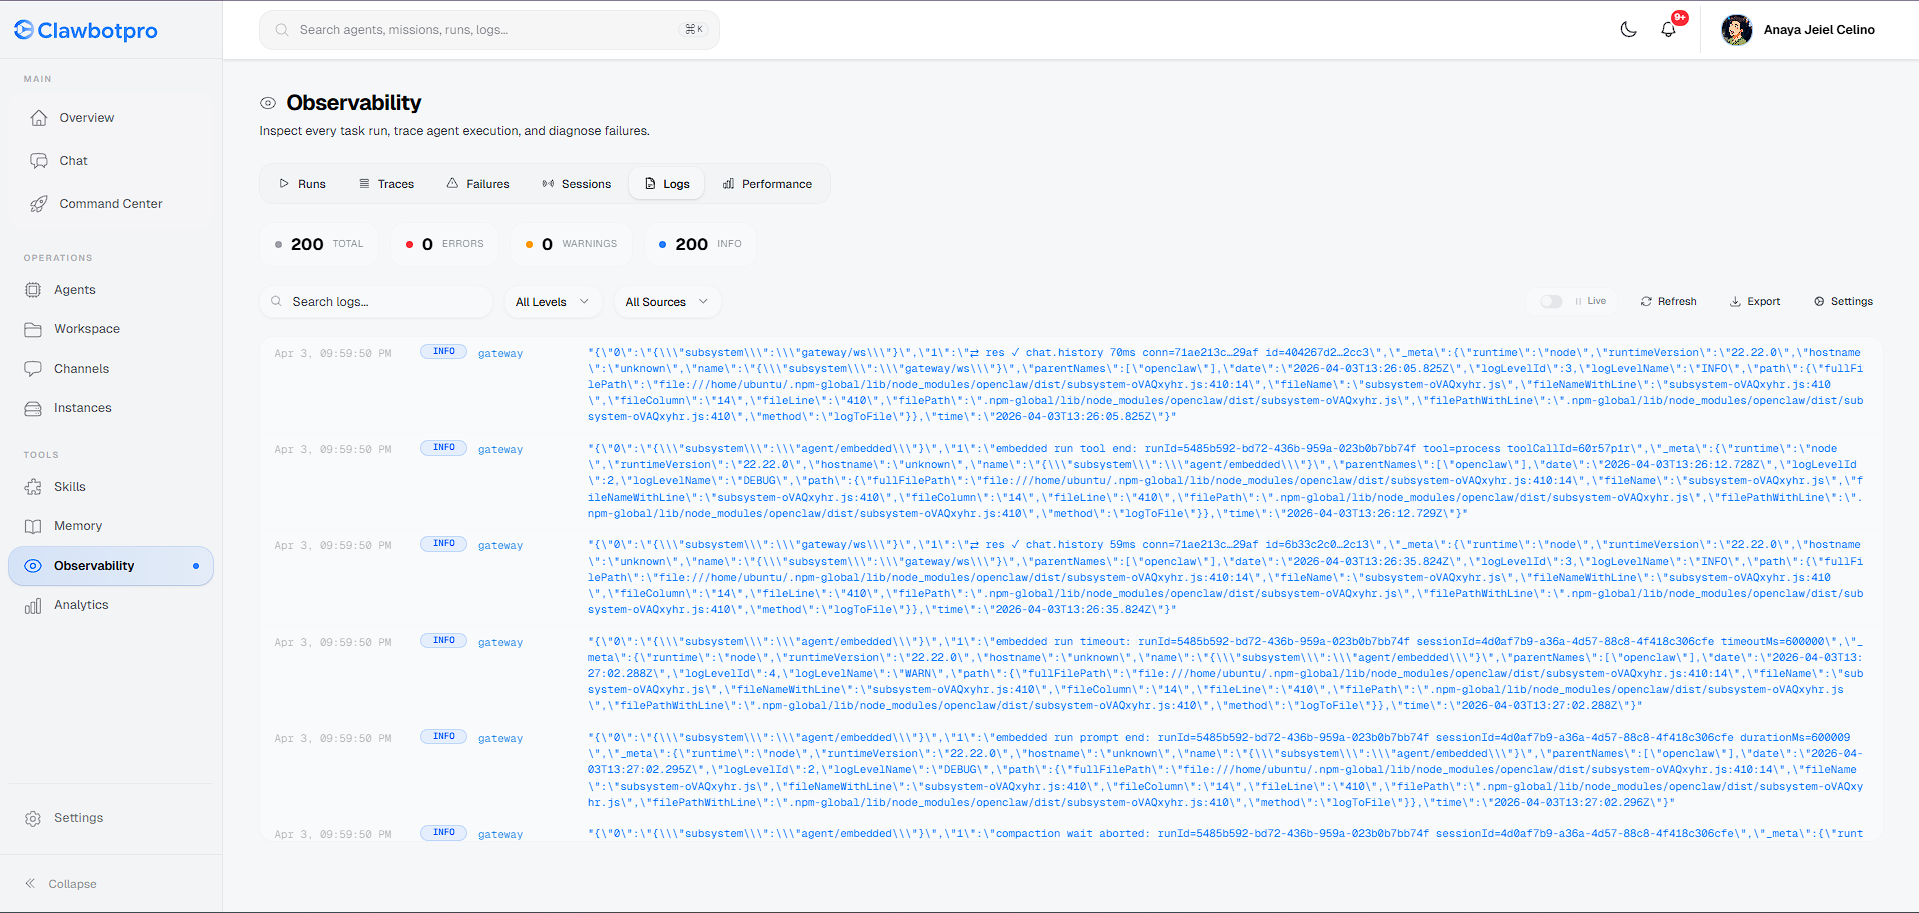
The Observability page is divided into specific diagnostic tabs:
- Runs & Failures: Lists every top-level execution. You can quickly filter for failed states (e.g., RateLimitExceeded or ToolExecutionError).
- Traces: This tab visualizes the ReAct loop. You can inspect the exact JSON input sent to an MCP tool, the raw response returned from the execution node, the time it took (
duration_ms), and the exact number of tokens consumed for that specific micro-decision. - Logs (Live Terminal): The Logs tab acts as a remote `tail -f` connection to your OpenClaw EC2 instance. It streams raw standard output (stdout) and standard error (stderr) directly from the underlying node. You can filter logs by severity level (INFO, WARN, ERROR) or by the specific agent subsystem generating them.